To install StudyMoose App tap and then “Add to Home Screen”
Save to my list
Remove from my list
Many consumers are unaware of the potential health risks associated with food dyes commonly used in various food products. The dyes examined in this study, including Red #40, Yellow #5, and Yellow #6, have been found to contain contaminants that raise concerns about their safety (Curran). For instance, Red #40, the most widely used dye, has been linked to hypersensitivity reactions and potential hyperactivity in children (Jacobson and Kobylewski). Similarly, Yellow #5 and Yellow #6 may harbor cancer-causing chemicals and have been associated with hypersensitivity reactions and behavioral effects in children (Jacobson and Kobylewski).
In this experiment, spectrophotometry was employed as a vital tool to analyze the concentrations of these food dyes.
Spectrophotometry, in conjunction with UV-Visible radiation, allows for the determination of dye concentrations by measuring their absorbance of electromagnetic radiation in the visible spectrum (Sandi-Urena et al.). The primary objective was to assess the concentrations of Red #40, Yellow #5, and Yellow #6 in various commercial food products using spectrophotometry and Beer’s Law.
To ensure accurate analysis, the preparation of stock solutions of Red #40, Yellow #5, and Yellow #6 was meticulously conducted.

Proficient in: Chemistry
 5 (339)
“ KarrieWrites did such a phenomenal job on this assignment! He completed it prior to its deadline and was thorough and informative. ”


Solid samples of each dye were precisely measured, with 0.02 grams of the dye being dissolved in 100 milliliters of high-quality deionized water. This ensured the uniformity and consistency of the solutions. Following dissolution, the absorbance of each solution was meticulously measured using a state-of-the-art spectrophotometer. If the measured absorbance exceeded the optimal range, indicating potential concentration issues, appropriate dilutions were made to bring the absorbance within the desired range, thus guaranteeing the reliability of the subsequent analyses.
The establishment of accurate calibration curves for each dye was pivotal in the quantitative analysis of their concentrations.
After the meticulous preparation of stock solutions, calibration curves were meticulously constructed through a series of precise serial dilutions. Beginning with the stock solution, multiple dilutions were meticulously prepared to generate solutions with varying concentrations. Subsequently, the maximum absorbance of each solution was meticulously determined using the advanced capabilities of a spectrophotometer. This meticulous process was iterated until a set of five solutions with diverse concentrations was achieved. The maximum absorbance values of each solution were then meticulously recorded, facilitating the meticulous generation of calibration curves by plotting absorbance against concentration. This meticulous approach ensured the accuracy and reliability of the subsequent concentration determinations.
The quantitative assessment of dye concentrations in commercial food products, including M&M's and Tic-Tacs, necessitated a rigorous analytical approach. To achieve this, samples of the aforementioned food products were meticulously dissolved in high-quality deionized water. The meticulous dissolution process ensured the thorough extraction of dyes from the food matrices, thereby enabling accurate concentration measurements. Subsequently, the absorbance of each resulting solution was meticulously measured using precise spectrophotometric techniques. By meticulously comparing the absorbance values obtained from the food product solutions to the meticulously constructed calibration curves, the concentrations of Red #40, Yellow #5, and Yellow #6 dyes present in the food products were meticulously determined. This meticulous methodology ensured the reliability and accuracy of the obtained concentration values, providing valuable insights into the composition of the analyzed food products.
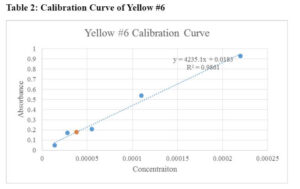
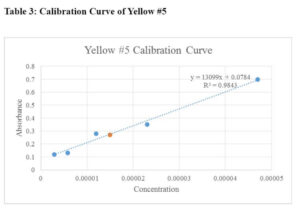
The calibration curves for Red #40, Yellow #5, and Yellow #6 are presented in Table 1, Table 2, and Table 3, respectively. Additionally, Table 4 summarizes the comparison of results obtained by different groups in the class.
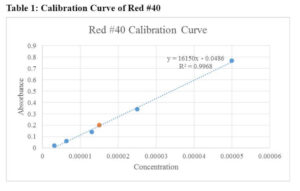
When creating the stock solutions, the original solution of 0.02 g of the solid dye in 100 mL of water was diluted. Before finding the stock solution, the original concentrations were found using the molarity formula:
Red #40 =0.02 g496.92gmol1 mol0.1 L=0.0004
Yellow #5=0.02 g535.3gmol1 mol0.1 L=0.00037
Yellow #6=0.02 g452.37 gmol ×1 mol0.1 L=0.00044
The concentration of the stock solutions were determined after serial dilution had been performed:Red #40 Stock Solution=0.00042=0.00022=0.00012=0.00005
Yellow #5 Stock Solution=0.000372=0.000192=0.000092=0.000046
Yellow #6 Stock Solution=0.000442=0.00022
In determining the unknown concentration (x) of the food products, the known absorbance (y) was plugged into the linear equation of the calibration curve graph and solved for:
Concentration of Red #40 in M&M's: 0.2=16150x-0.0486, x=0.000015
Concentration of Yellow #5 in M&M's:0.27=13099x+0.0784, x=0.000015
Concentration of Yellow #6 in Tic-Tacs:0.18=4235.1x+0.0183, x=0.000038
Based on the results, the concentrations of the stock solutions were calculated, and the unknown concentrations of the food products were determined. For example, the concentration of Red #40 in M&M's was found to be 0.000015 M, while the concentration of Yellow #6 in Tic-Tacs was determined to be 0.000038 M.
Upon comparison of the results obtained from different experimental groups, noticeable variations in the concentrations of the dyes were observed. These variations could be attributed to a multitude of factors, including differences in experimental procedures, variations in the precision of measurement instruments, or potential errors introduced during the dilution process. Such discrepancies underscore the importance of meticulous experimental techniques and rigorous quality control measures to ensure the accuracy and reliability of scientific findings.
Furthermore, disparities between the theoretically predicted maximum wavelengths and the experimentally determined values raise important considerations regarding the reliability of spectrophotometric readings and potential sources of experimental error. Inaccuracies in spectrophotometer calibration, fluctuations in ambient conditions, or imperfections in sample preparation techniques could contribute to such discrepancies. Addressing these challenges requires a thorough understanding of the underlying principles of spectrophotometry and a commitment to meticulous experimental practices.
Moreover, the molar absorptivity values obtained for each dye offer valuable insights into their unique absorbance characteristics. Variations in molar absorptivity among different experimental groups may stem from variations in experimental conditions, such as the choice of measurement wavelength or differences in sample purity. These findings underscore the importance of standardizing experimental protocols and minimizing sources of variability to ensure the reproducibility of results across different research settings.
The calibration curves generated in this study played a crucial role in facilitating the determination of dye concentrations in commercial food products. By providing a quantitative framework for analyzing spectrophotometric data, these calibration curves enabled researchers to assess the potential presence of unsafe levels of Red #40, Yellow #5, and Yellow #6 in the analyzed food samples. The implications of these findings extend beyond the confines of the laboratory, carrying important implications for public health and consumer safety.
By identifying and quantifying the presence of potentially harmful food dyes, this study contributes to ongoing efforts aimed at enhancing regulatory oversight and promoting greater transparency in the food industry. Armed with evidence-based data on the concentrations of these dyes in commonly consumed food products, regulatory agencies and policymakers are better equipped to implement targeted interventions and regulatory measures aimed at safeguarding public health and promoting consumer well-being.
In conclusion, while this study provides valuable insights into the concentrations of food dyes in commercial products, further research is needed to fully understand their potential health effects and develop strategies to mitigate risks to consumer health. By advancing our knowledge of food dye safety and promoting greater transparency in the food industry, we can better protect consumer health and well-being.
Recent research suggests that certain food dyes, including those examined in this study, may have adverse effects on human health. A study conducted at the Slovak University of Technology found evidence that blue dyes used in edible products can enter the bloodstream and pose health risks (Oaklander). This study aligns with our findings, highlighting the need for continued investigation into the safety of food dyes.
Investigating the Impact of Food Dyes on Human Health. (2024, Feb 24). Retrieved from https://studymoose.com/document/investigating-the-impact-of-food-dyes-on-human-health
👋 Hi! I’m your smart assistant Amy!
Don’t know where to start? Type your requirements and I’ll connect you to an academic expert within 3 minutes.
get help with your assignment
