To install StudyMoose App tap and then “Add to Home Screen”
Save to my list
Remove from my list
This investigation represents a comprehensive exploration into the analysis of FD&C food dyes present in sports drinks, employing advanced techniques of spectroscopy and graphical analysis. By engaging in this experiment, students are poised to refine a multitude of critical laboratory skills. These skills encompass not only the precise preparation of serial dilutions but also extend to the nuanced comprehension of spectroscopic measurements and the adept extrapolation of data through graphical representations. Such multifaceted skill development is integral to fostering a deeper understanding of analytical chemistry principles and their real-world applications within the realm of food science and consumer product evaluation.
As students immerse themselves in this investigative journey, they are not only enhancing their practical laboratory competencies but are also nurturing a broader scientific mindset characterized by meticulous observation, analytical thinking, and methodical problem-solving abilities.
The examination of a solution's color constitutes a fundamental tool wielded by scientists to glean insights into its composition.

Proficient in: Chemistry
 4.7 (657)
“ Really polite, and a great writer! Task done as described and better, responded to all my questions promptly too! ”


Color, as a physical property, serves dual purposes in scientific endeavors, facilitating both qualitative and quantitative analyses. Qualitative methods furnish information regarding the nature or identity of compounds within a sample, while quantitative techniques yield numerical data pertaining to compound concentrations. At the heart of these analyses lies spectroscopy, an interdisciplinary field centered on the study of the interaction between light and matter.
Spectroscopy is the study of the interaction of light and matter. A spectrophotometer is aninstrument that uses electromagnetic radiation from a selected region of the electromagnetic
spectrum such as ultraviolet, visible or infrared light, to analyze the absorption or transmission of radiation by a sample.
The basic function of a spectrophotometer is shown in Figure1. The electromagnetic spectrum (see Figure 2) is the entire range of possible wavelengths orfrequencies of electromagnetic radiation.


Spectrophotometry, a cornerstone of spectroscopic analysis, employs specialized instruments known as spectrophotometers to scrutinize the absorption or transmission of electromagnetic radiation by samples. In our investigation, we delve into the realm of visible spectrophotometry, where the electromagnetic spectrum undergoes meticulous scrutiny within the range perceptible to human vision, spanning from 380 nanometers to 750 nanometers.
Visible spectrophotometers, equipped with light sources such as xenon and tungsten lamps, enable the examination of samples through glass cuvets or test tubes, with more advanced variants necessitating quartz cells for optimal performance. The functionality of these instruments relies on a monochromator, a diffraction grating tasked with dispersing light into its constituent wavelengths. The desired wavelength is then directed onto the sample for analysis, facilitating the detection of light absorption or emission by substances within the sample.
In spectrophotometric analysis, the selection of the appropriate wavelength is paramount. This wavelength, determined through the visible spectrum of the substance under examination, corresponds to the peak absorbance, denoted as lambda max (λmax). For instance, FD&C Blue 1, one of the seven FDA-approved food dyes, exhibits a lambda max of 630 nanometers, indicative of its characteristic absorption profile.
The absorption of visible light by substances stems from electron transitions, wherein ground-state electrons ascend to higher energy atomic or molecular orbitals. This transition is contingent upon the energy difference between the involved electron energy levels. Notably, the molecular or electronic structure of a substance dictates the wavelength of light absorption, with absorption intensity correlating directly with solution concentration and path length.
Principles elucidated through spectrophotometric analysis are underpinned by Beer's law, which quantifies the relationship between light absorption, substance concentration, and path length. This law, encapsulated within the equation A = abc, highlights the pivotal role of the molar absorptivity coefficient (a) as a substance-specific constant.
In essence, spectrophotometry serves as a powerful analytical tool, leveraging the principles of light-matter interaction to unravel the chemical intricacies of diverse substances. Through meticulous experimentation and data analysis, scientists unlock a wealth of information embedded within the spectral signatures of materials, advancing our understanding of their composition and behavior in myriad scientific domains.
The primary objective of this advanced inquiry laboratory session revolves around the utilization of spectroscopy in tandem with graphical analysis to ascertain the concentration of dye present within a sports beverage. Commencing with an introductory exercise, participants engage in the meticulous preparation of a series of standard dilutions derived from an FD&C Blue 1 stock solution, followed by the meticulous measurement of the percent transmittance exhibited by each dilution. Subsequent to data collection, an in-depth graphical analysis ensues, aiming to discern an optimal linear relationship among various key functions, including transmittance (T), percent transmittance (% T), logarithm of transmittance (log T), and absorbance (A), pivotal for constructing a robust Beer's law calibration curve.
This experimental framework not only serves as a practical demonstration but also offers a structured model for guided-inquiry exploration into the determination of food dye concentration within sports beverages and other analogous consumer products. Furthermore, the flexibility of the procedure allows for the inclusion of additional dyes, such as FD&C Yellow 5 and FD&C Red 40, providing avenues for optional extensions or collaborative classroom investigations. Through such comprehensive experimentation, participants are poised to deepen their understanding of spectroscopic analysis techniques and their application in real-world scenarios, particularly in the realm of food and beverage analysis.
Once the spectroscopic data has been acquired, students will embark on the task of discerning the most suitable linear correlation to effectively gauge the concentration of an enigmatic solution harboring FD&C Blue 1 dye. Through the meticulous construction of calibration curves and the judicious application of Beer’s law, learners will ascertain the precise concentration of the dye dispersed within an array of beverages. This investigative endeavor extends further into optional explorations, encompassing the analysis of additional FD&C dyes and the subsequent comparison of their distinctive absorbance spectra, thus broadening the scope of inquiry and fostering a deeper understanding of the principles underlying spectrophotometric analysis.
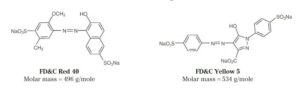
FD&C dyes stand as intricate representatives of organic molecules, adorned with chemical structures characterized by the presence of multiple carbon rings intricately interwoven with double bonds (as depicted in Figure 3 on page 2). Within these molecular constructs, the phenomenon of conjugation emerges, a pattern of bonding where a series of double bonds are interspersed with single bonds. This intricate dance of electrons results in a diminished gap between the ground state and the excited state, thereby translating into a distinctive energy signature that aligns with photons in the visible spectrum.
As the degree of conjugation amplifies, so does the quantum of absorbed energy photons, a phenomenon deeply intertwined with the principles of spectral absorption. In the realm of FD&C dyes, the hierarchy of absorption prowess unfolds: FD&C Blue 1 dye reigns supreme in absorbing light of the lowest energy, trailed by Red 40 and Yellow 5, which exhibit a penchant for higher energy absorptions. To unveil the intricate dance of these dyes, an exploration into their visible spectra ensues. By meticulously charting the wavelength of light that elicits maximum absorbance, denoted as λmax, for each dye, students delve into the nuances of their spectral signatures.
A crucial facet of this exploration involves the synthesis of a comprehensive overlay graph, showcasing the visible spectra of all dyes in a harmonious symphony of absorption peaks and valleys. Through this visual exposition, learners are poised to discern subtle nuances, facilitating comparative analyses and insightful observations. Armed with this foundational knowledge, students embark on the meticulous preparation of solutions and the subsequent generation of Beer’s law plots.
Within this analytical framework, the concentrations of these dyes within a diverse array of beverages become the focal point of inquiry. By applying the tenets of Beer’s law to spectrophotometric data, students unravel the mysteries concealed within each beverage's hue. This journey transcends mere analysis; it is an odyssey of scientific exploration, where each spectral peak and trough unveils a fragment of the complex tapestry woven by FD&C dyes.
In Figure 3, the structural blueprints and molar masses of FD&C Red 40 and Yellow 5 stand as beacons, guiding students through the labyrinth of chemical intricacies. Armed with this knowledge, learners are empowered to navigate the intricate dance of molecular absorption and emerge with a deeper understanding of the subtle interplay between structure and spectroscopy.
Analysis of Food Dyes in Beverages. (2024, Feb 23). Retrieved from https://studymoose.com/document/analysis-of-food-dyes-in-beverages

👋 Hi! I’m your smart assistant Amy!
Don’t know where to start? Type your requirements and I’ll connect you to an academic expert within 3 minutes.
get help with your assignment

